A distributed workforce depends on a high speed, reliable communications network accessible to all. In this paper, we review how the UK and Australian communications networks held up over the lockdown period – and look at some interesting changes in work patterns as revealed by our network usage.
The short message is that ‘the gaming nerds saved us’. But as we look to build new ways of working, and a more resilient society and economy against future pandemics – what lessons can we take from the COVID experience for our communications network infrastructure.
What happened in the UK?
A leading UK communications specialist, Rob Kenny, has released a paper reviewing the data on how UK broadband networks are coping with increased COVID-19 traffic levels.
Rob finds that “[b]ecause the network was always configured for sudden spikes of traffic such as game releases (the ‘busiest hours’ as it were), it was relatively well placed for extra traffic driven by COVID-19’:
- At 8.05pm on 11 March 2020, Internet traffic through the London Internet exchange (LINX) peaked at its then highest level ever - 4.5 Tbps – as end users rushed to download the new combat game, Warzone.
- Six weeks later with most of the UK population at home, usage in London in the residential busy hour (4.30-8.30pm) typically peaks at around 5 Tbps. While this is up 25% on the pre-COVID evening peak, it was only up 10% on the Warzone peak.
The paper has some other interesting observations on our emerging WFH life as told by our data usage:
- As expected, the geographic distribution of data peaks in networks has shifted from CBDs to the suburbs, as those of you familiar with the London Tube map will recognise: red means decreased usage and green means increased usage.
Diagram 1: Geographic shift in London broadband usage
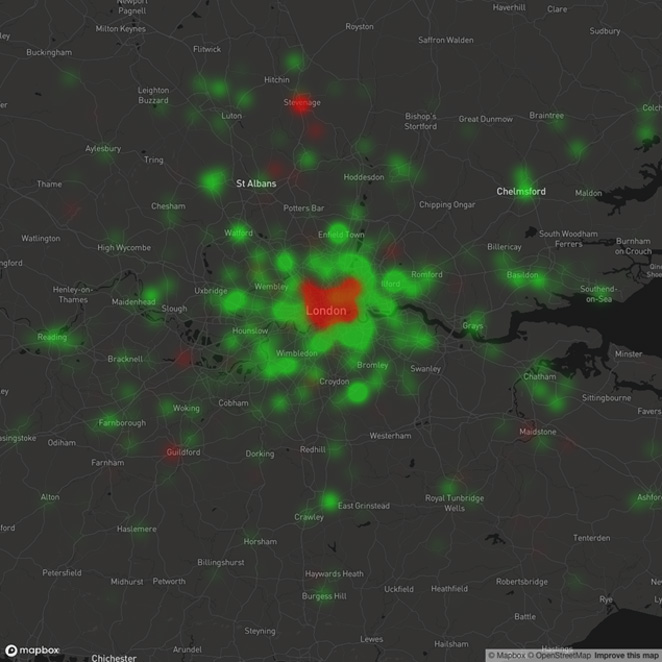
Sourced from Cloudflare.
- In the pre-COVID-19 world, UK users were already using, on average, 2.2 times the data at home than when we are at work or at school. Contrary to what we all might think with all those Zoom video conferences, working from home is not particularly bandwidth intensive – not at least compared to our pre-COVID evenings. While Zoom’s number meeting participants has jumped from 10m to 200m, a Zoom HD group call requires 1.5Mbps whereas watching Tiger King on Netflix chews through 4-5 Mbps;
- UK dwellers are turning into ‘night owls’. The greatest increase in traffic since lock down – by a third – is around midnight. As Rob says, "Clearly this is not because many more people are at home. Rather it is because they are home and awake. In normal times, 77% of individuals would be asleep at midnight, but without work to go to next morning, they are staying up and online longer”;
- The UK broadband networks are holding up surprisingly well under the onslaught of WFH traffic. VirginMedia, one of the largest broadband providers, has seen its speed levels hold steady and even increase over the lock down period;
- UK broadband providers are confident enough about their capacity to handle the extra traffic that they have agreed to remove data caps during the COVID-19 crisis.
What happened in Australia?
Rob’s analysis helps us understand similar trends in Australia.
Here’s how traffic geographically shifted in Sydney:
Diagram 2: Geographic shift in broadband usage in Sydney
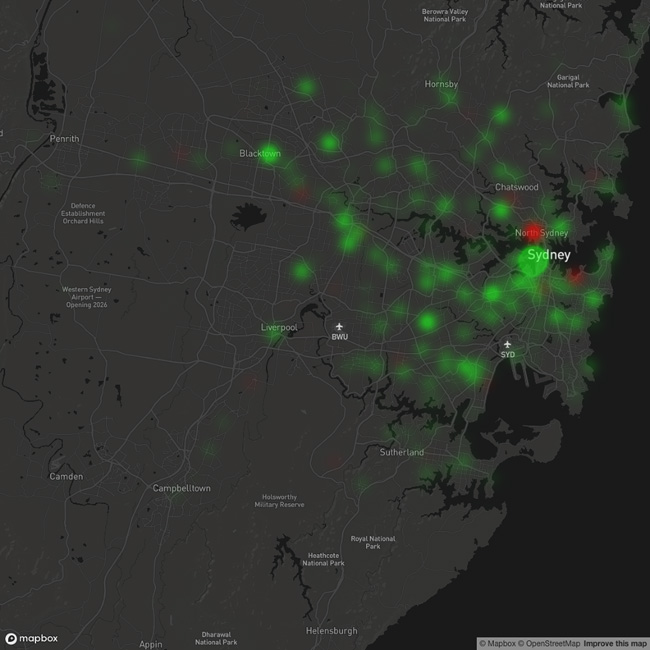
Sourced from Cloudflare.
The geographic shift in Sydney is less pronounced than London. While there is a clear decline in the North Sydney business district, usage rose in the Western CBD fringe and close inner West of Sydney. This may reflect the residential/commercial mix in the inner city area – perhaps even a cluster of hotels used as COVID quarantine! Usage decreased in the inner East of Sydney, around Double Bay/Rose Bay – perhaps that reflects COVID escapees to second homes outside Sydney!
Diagram 3: Geographic shift in broadband usage in Melbourne
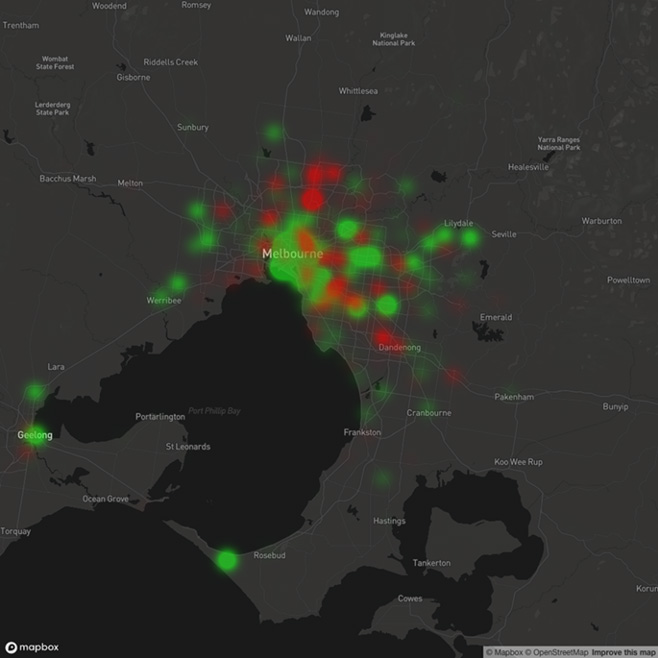
Sourced from Cloudflare.
Melbourne has seen a wider spread of areas of decreased usage. In addition to the CDB areas, there were decreases in Northern areas, around Broadmeadows, which may reflect closure of industrial and commercial areas. Geelong, with less commuters to Melbourne, saw a strong increase, but so did more distant areas such Portsea – again possibly COVID ‘refugees’ to holiday homes. Dandenong, which tends to be a lower socio-economic area, also saw a decline.
NBN co also publishes data comparing traffic on its network pre and post lock down. The NBN data separately measures downchannel traffic – basically things we are downloading and watching, such as Netflix - and upchannel traffic – basically things we are sending out, our video feed into Zoom/Webex/Microsoft teams meetings.
This is what the increased downloading looks like compared to the period immediately before the COVID lockdown:
Diagram 4: Downstream Usage changes over lockdown period
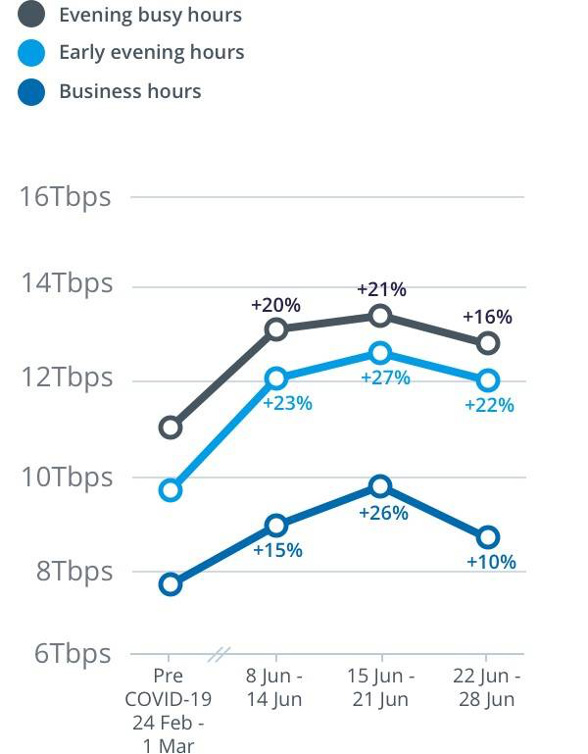
Key:
- Evening busy hours are Monday to Sunday 8pm to 11.59pm
- Early evening hours are Monday to Sunday 5pm to 8pm
- Business hours are Monday to Friday 8am to 4.59pm.
The changes in downloading over a 24 hour period are depicted below:
Diagram 5: Before and During COVID Downloading habits over a 24 hour period
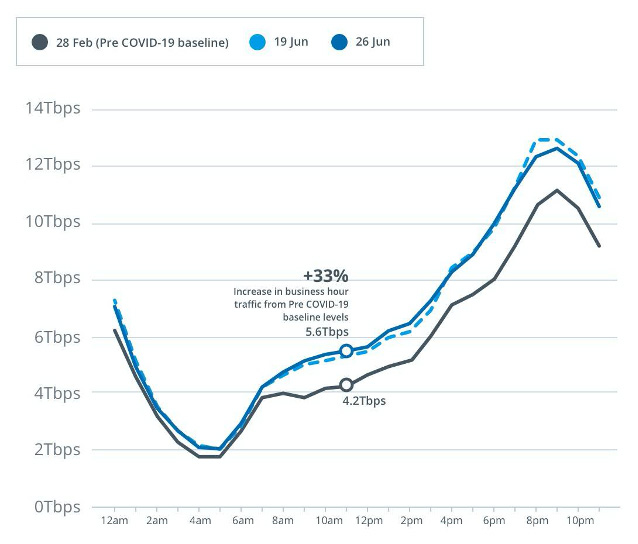
A couple of interesting things to note about our downloading habits over the lockdown:
- Even during the peak WFH in mid-June, the total network usage was below the level in the busy evening hours pre-COVID. As the network is configured to handle the peak demand, this means the nbn was already well equipped to handle WFH – as in the UK, the gamers (or more probably streaming viewers) saved us!
- The curve looks pretty much the same across the traditional working hours and the traditional ‘leisure’ hours. This could mean that we were reasonably productive at home – or that our Netflix obsession ‘bled’ into our working hours;
- Unlike the British, we have tended not to become night owls. While some of us are watching more, the pattern of drop off after 9pm is much the same pre COVID and during lockdown; and
- Usage during business hours is almost back to ‘normal’, which probably suggests more of us are back in the office, but even so our network usage outside work hours is still substantially above pre-COVID levels. This might reflect more flexibility in our working patterns, with people working in the evenings. Or it might just mean that our video streaming habits became more deeply entrenched over lockdown.
The upchannel usage changes are depicted below:
Diagram 6: Upchannel usage changes over lockdown period
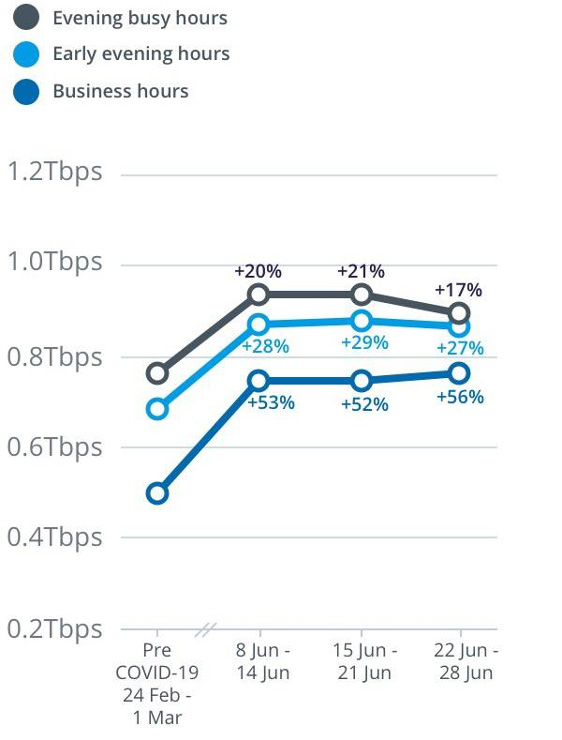
Diagram 7: Before and During COVID Uploading habits over a 24 hour period
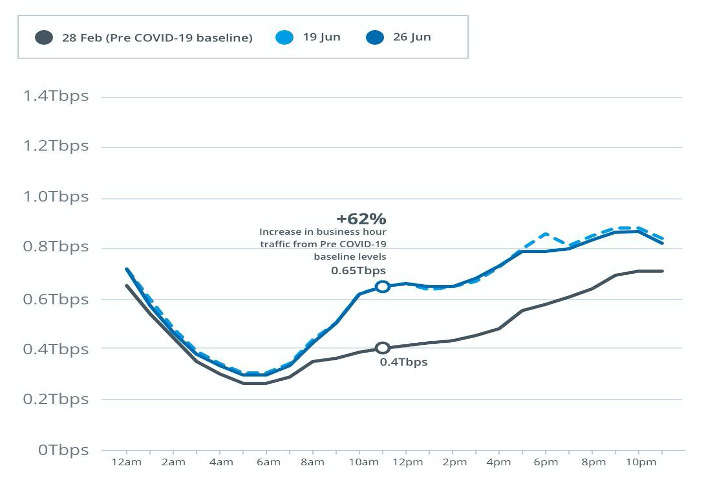
The uploading data potentially tells a much more interesting story than the downloading data:
- The steady increase pre-COVID in uploading in the early afternoon onwards probably reflects the gamers and Youtube content creators. While the downloaders are heading to bed around 9.30pm (see graph 5), the gamers and other ‘uploaders’ are at peak activity around 10pm;
- While downloading continues to be more than 10 times the volume of uploading, uploading traffic increase at twice the level of downloading over the COVID period (52% vs 26%) during business hours at the peak of the lockdown). This is likely to be associated with WFH;
- Even with this massive increase in uploading in business hours, the peak uploading level during the peak of lockdown was still below the peak pre-COVID uploading – thanks again to the gamers!
- Although downloading during business hours is heading back to ‘normal’ (diagram 4), uploading during business hours is still 56% up on pre-COVID levels. This suggests that there is still a high level of WFH video conferencing going on.
- During lock down, the level of upchannel traffic continued to be substantially above the pre-COVID levels, even though the gamers may have been coming online. This trend continued through to around 7pm. This may suggest that we were still taking video calls outside normal business hours, possibly because we were working more flexibly at home;
- Even if more of us are heading back to the office, the upchannel usage in the evenings co9ntinues to follow much the same upwards curve as it did during the peak of the lockdown. This might reflect more flexibility in work patterns, with a split of WFH and work in the office. This might also support concerns some have expressed that WFH means work has ‘bled’ into our private lives – hence, downtime is no longer download time!
- In the last week of June, nbn co reported the peak uploading occurred during the evening busy hours on Sunday 28 June. Were we getting ready for work on Monday morning, or were the accountants and lawyers busy with EOFY?
The impact of the COVID outbreak in Melbourne can be seen. In a press release on 2 July, nbn co says:
A 15 – 20 per cent surge in peak data demand on nbn's main wholesale access service was observed in Victoria last week as residents in areas of Melbourne spent more time at home. Data demand in Melbourne from 22-28 June in particular has not followed the national trend of the last few weeks that has seen a relative easing of peak data demand elsewhere in Australia
Conclusion
Much of this is supposition – but the data seems to tell an interesting story.
First, it clearly says we were able to WFH fairly successfully in the lockdown because the network, particularly in the upchannel to support video meetings, was already configured at adequate peak demand levels because of the demands of gamers etc pre-COVID.
Second, it may show that WFH did involve significant work flexibility outside ‘normal’ business hours.
Third, it may also show that with the return to the office during business hours, this pattern of work flexibility is persisting. There will be differences of opinion on the positives and negatives of that.

Visit SmartCounsel
