Chapter 6 of Gilbert + Tobin’s 2022 Takeovers and Schemes Review (below) explores success factors in public mergers and acquisitions in 2021.
Success rates up, with a perfect scorecard in high-value mergers and acquisitions
82% of all public mergers and acquisitions valued over $50 million were successful in 2021. This represents a material increase from the headline success rate of 76% in 2020 as bidders, targets and the market more broadly adjusted to the “new normal” of executing deals against the backdrop of the COVID-19 pandemic.
At the outset, it should be noted that our data is based on announced transactions which involve a takeover bid or, in the case of a scheme of arrangement, an agreed implementation deed. This may overstate the true success rate as many transactions fail at the non-binding offer stage and may not be announced which means this is impossible to track. Nevertheless, the publicly announced data does give an accurate picture of the success of bidder’s converting an agreed deal or a deal announced by the bidder into a successful one.
In this context, high-value transactions (i.e. those valued above $500 million) had a 100% success rate in 2021, significantly up from 67% in 2020. It was in transactions valued between $50 million to $500 million where success was not assured, with 74% of these transactions successful (the lowest success rate in this category since 2017).
It is interesting to observe the circumstances in which transactions were not successful in 2021:
- Competing bids for Mainstream. A competitive process to acquire Mainstream saw three competing offers emerge, with Apex ultimately defeating SS&C and Vistra. Apex had to pay up big to win the day, offering a 133% premium to the price originally tabled by Vistra and recommended by the Mainstream board. More on this in Chapter 8 – Implementation agreements and bid conditions in public mergers and acquisitions in 2021.
- Boards say ‘no’ to on-market bids. The three on-market bids valued over $50 million had a few things in common – they were unsolicited, pitched at skinny premiums and rejected by the target board. Each such bid was ultimately unsuccessful. Albeit the bidder for Thorn Group was able to double the size of its shareholding to just below 50% and the McPherson’s shareholders may question their board’s recommendation given the current share price is significantly (35%) below the bid price.
- Board recommendation doesn’t guarantee success. The board of PM Capital Asian Opportunities Fund (PAF) made clear to shareholders that it considered a merger with PM Capital Global Opportunities Fund to be a better option than a hostile takeover bid from WAM Capital (WAM). The majority of shareholders agreed with the board, but this wasn’t enough to get the merger over the line, as WAM used its stake in PAF to vote down the merger. WAM ultimately achieved its objective, securing the recommendation of the PAF board and acquiring 100% of PAF. The transaction was also notable for the potential for conflicts of interest to arise as each of the merger parties, Capital Asian Opportunities Fund and PM Capital Global Opportunities Fund, had the same investment manager and the successful application by WAM to the Takeovers Panel which made a declaration of unacceptable circumstances in respect of various matters relating to the acquisition of shares by shareholders connected with the investment manager following the announcement of the deal.
- No COVID casualties. Unlike 2020, where we saw multiple announced deals that did not proceed on the basis of MAC conditions or other conditions triggered by the impact of the COVID-19 pandemic, no public company acquisition valued over $50 million failed in 2021 due to the prolonged period of uncertainty caused by the pandemic. The key difference being bidders in 2021 were able to take account COVID-19 factors before launching.
Success rates

The success rates for 2022 described in this Chapter do not include 12 transactions which were still current as at 14 February 2022. The success rates for 2017 to 2021 have been updated to reflect the ultimate outcome of all transactions which were analysed in those past Reviews.
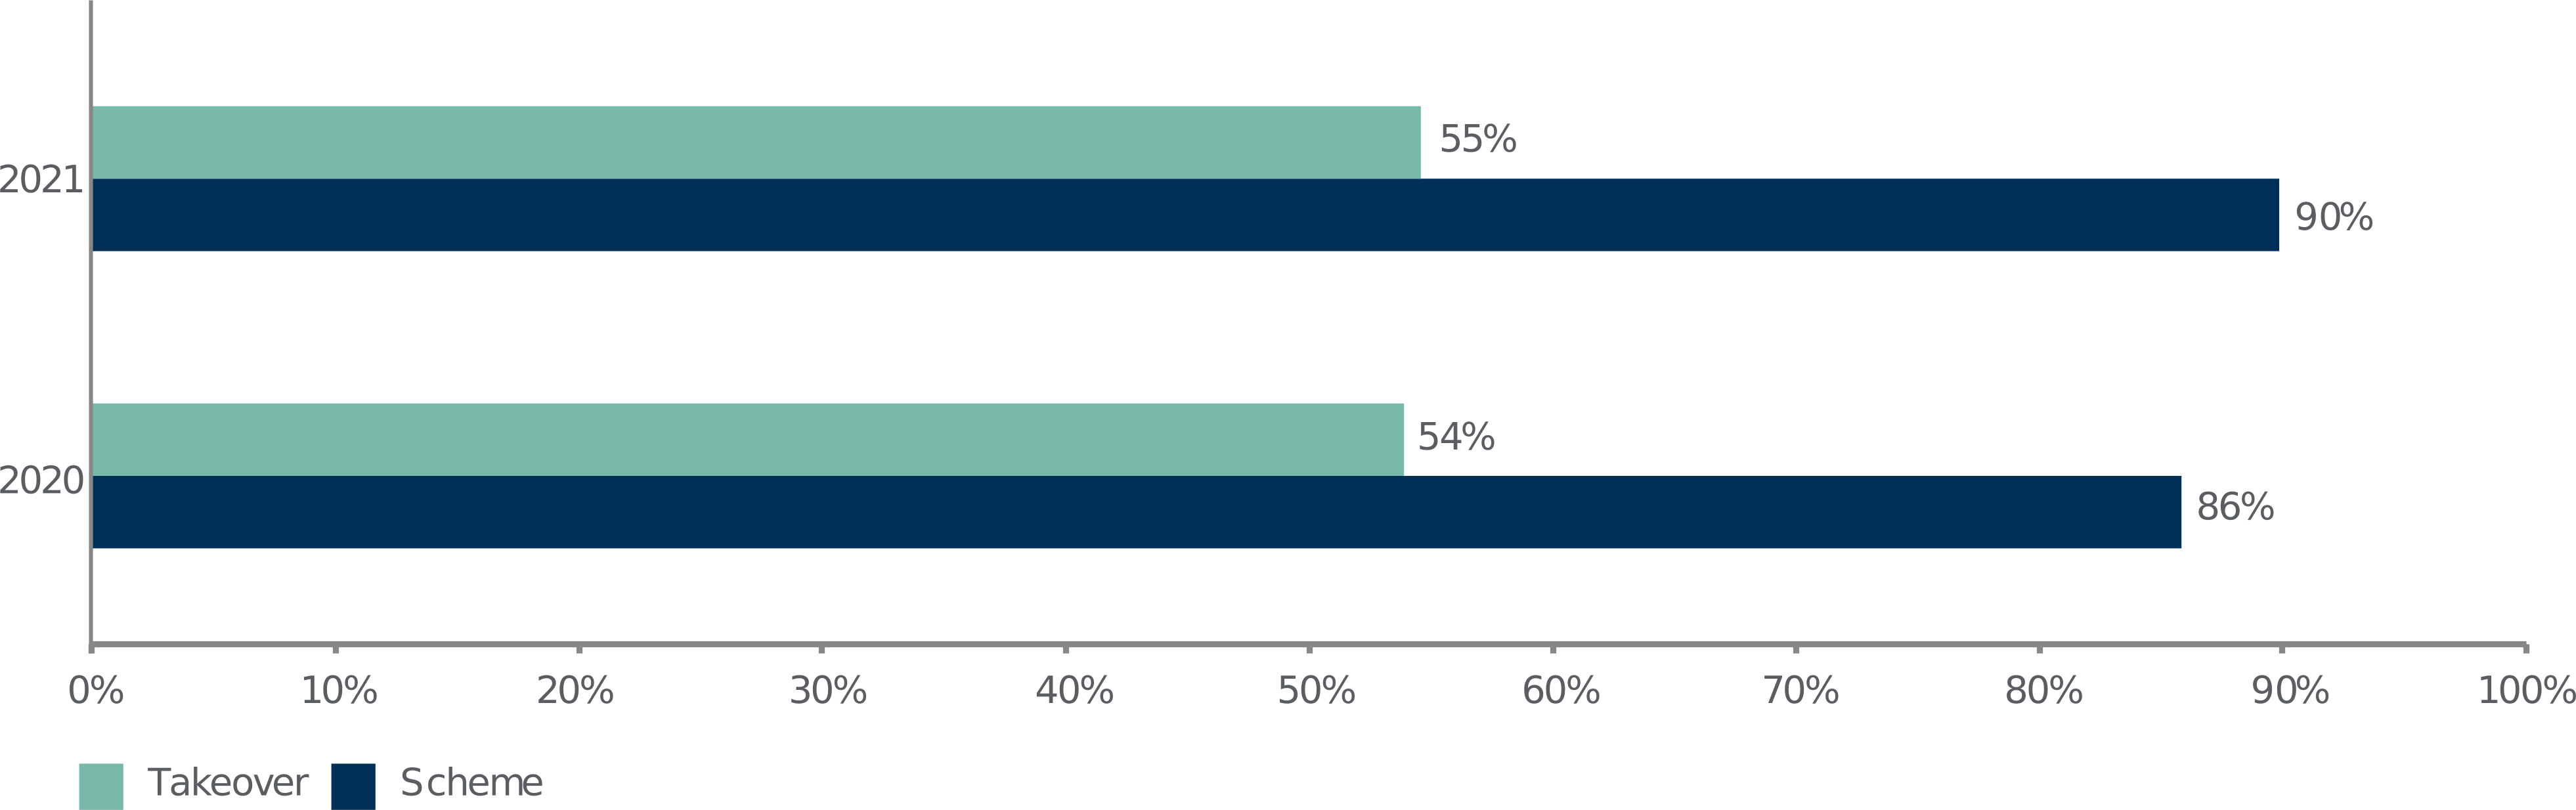
Schemes of arrangement provide a more certain path to success
Consistent with 2020, we saw schemes of arrangement deliver much higher success rates as compared to takeovers in 2021 (90% vs 55%). While friendly bids for PrimeWest, Cashrewards and Apollo Consolidated achieved successful outcomes, only 43% of hostile bids were successful (broadly on par with 2020). The highlight here was Seven Group’s bid for Boral, which showed that hostile bids can still be very effective (even for billion dollar transactions).
Success rates for takeovers v schemes
Success rates for friendly and hostile transactions

Decrease in premiums on larger M&A deals
The average premium offered by bidders for public mergers and acquisitions over $50 million dropped to 37% in 2021 after reaching 67% in 2020. This fall could be said to reflect the lower stock prices in the first half of 2020 requiring a higher premium to get target boards and shareholders to agree to accept acquisition proposals. That is, it was in some respects inevitable with generally higher stock prices in 2021 that the premiums in bids would be lower than 2020.
For transactions valued over $500 million, the average premium was 27%, perhaps reflective of the large cheque sizes for deals of that scale. Interestingly, scrip premiums were on average just over half the size of premiums in cash deals (24% compared with 43%).
Average premiums paid

The competing bids for Mainstream and the scheme for Redlex both made the list of the top 10 highest premiums offered over the past five years. The acquisition of Tilt Renewables fell just short of the top 10, with a final premium of 119%.
The top 10 transactions by premium offered in the past five years |
|||
|---|---|---|---|
|
Rank |
Year |
Premium |
Deal |
|
1 |
2020 |
Over 320% |
Competing bids for Cardinal Resources including Dongshan Investments’ proposed $665 million takeover bid (380%); Shandong Gold’s successful $565 million acquisition (330%); Nord Gold’s and Engineers & Planners Co’s proposed $552 million takeover bids (each, 320%) |
|
2 |
2018 |
275% |
PT Bayan Resources TBK’s successful $515 million acquisition of Kangaroo Resources by scheme of arrangement |
|
3 |
2018 |
233% |
Zijin Mining Group’s proposed $90 million takeover bid for Nkwe Platinum |
|
4 |
2020 |
203% |
Hub24’s proposed $60 million acquisition of Xplore Wealth |
|
5 |
2018 |
177% |
Merck & Co’s successful $502 million acquisition of Viralytics by scheme of arrangement |
|
6 |
2021 |
153% |
Apex Group’s successful $400 million acquisition of Mainstream by scheme of arrangement at a 153% premium, defeating competing bids from Vistra (9% premium offered) and SS&C Technologies (150% premium offered) |
|
7 |
2018 |
142% |
Hancock Prospecting’s successful $426 million takeover bid for Atlas Iron |
|
8 |
2019 |
141% |
Advanced Personnel Management’s successful $74 million acquisition of Konekt by scheme of arrangement |
|
9 |
2021 |
140% |
Verra Mobility’s successful $146 million acquisition of Redflex Holdings by scheme of arrangement |
|
10 |
2018 |
120% |
OZ Minerals’ successful $418 million takeover bid for Avanco Resources |
Top five premiums paid in 2021 |
||
|---|---|---|
|
Rank |
Premium |
Deal |
|
1 |
153% |
Apex Group’s successful $400 million acquisition of Mainstream by scheme of arrangement |
|
2 |
140% |
Verra Mobility’s successful $146 million acquisition of Redflex Holdings by scheme of arrangement |
|
3 |
119% |
PowAR consortium and Mercury NZ’s successful $2.8 billion acquisition of Tilt Renewables by scheme of arrangement |
|
4 |
91% |
Busy Bees Early Learning Australia’s successful $197 million acquisition of Think Childcare Group by scheme of arrangement |
|
5 |
82% |
HelloFresh’s successful $125.3 million acquisition of Youfoodz Holdings by scheme of arrangement |
Pre-bid stakes in public mergers and acquisitions
The bidder had a pre-bid stake of some kind in 39% of all transactions valued over $50 million in 2021. This was the lowest proportion we have seen in the last five years.
A pre-bid shareholding remained the most common form of pre-bid stake in 2020, being used in 71% of all transactions involving a pre-bid arrangement. This was followed by pre-bid agreements with shareholders, which were present in 33% of all transactions involving a pre-bid arrangement.
The move away from cash settled equity swaps observed in recent years has continued, with only one bidder using this type of instrument (or at least insofar as is evident from public disclosures), being Seven Group in its hostile bid for Boral. At the time the off-market takeover bid was announced, Seven Group had an interest in approximately 23.18% of Boral. The equity swap acquired by Seven Group approximately one month before the hostile bid was announced was limited to 3% (taking its interest to 22.98% at that time), which was all that was permitted under its creep capacity. Seven’s interest increased to 23.18% by the date of announcement of the bid as a result of Boral’s on-market buyback.
Bidders starting with pre-bid stakes

Types of pre-bid arrangements (2021)


Visit Smart Counsel
